


![]()
By multiplying milestones, we transform a long, amorphous race into one with many intermediate ‘finish lines’. As we push through each one, we experience a burst of pride as well as a jolt of energy to charge towards the next one.
—Chip and Dan Heath, The Power of Moments
Measure and Grow
Measure and Grow is the way portfolios evaluate their progress towards business agility and determine their next improvement steps.The Lean-Agile transformation and the journey to Business Agility is a major undertaking for every enterprise. Many executives have commented that this transformation was one of the most difficult—but the single most rewarding—change that they have personally experienced in their entire careers.
The business benefits of business agility are clear: faster time to market for more innovative solutions; higher quality and productivity; higher levels of employee engagement; opportunity for a new and enhanced culture, and ultimately, the ability to thrive in the digital age. But for those new to the endeavor, the question naturally arises as to where and how to begin. That is the purpose of the SAFe Implementation Roadmap, a proven pattern that has been shown to work in enterprises around the world. And yet, even when moving down the roadmap, the question for the enterprise becomes: How do we know how we are doing? Are we growing in the right areas? What do we do about the deficiencies we know we have? Where should we target our next effort?
To reinforce and accelerate the SAFe transformation, leaders need to ‘measure and grow’ the implementation at various points along the journey. This will help maintain the energy and enthusiasm they are devoting to the short cycles of Iterations and Program Increments (PIs) while setting their sights on the larger goals of true business agility.
Details
‘Measure and grow’ is the term we use to describe how SAFe value stream portfolios evaluate their progress towards business agility and determine the next improvement steps. It describes how to measure the current state of a portfolio and grow to improve overall business outcomes.
Measure and grow are accomplished via two separate assessment mechanisms, designed for significantly different audiences and different purposes.
- The SAFe Business Agility Assessment (Figure 1) is designed for LPM and portfolio stakeholders to assess their overall progress on the ultimate goal of true business agility.
- The SAFe Core Competency Assessments (Figure 2) are used to help teams and trains improve on the technical and business practices they need to help the portfolio achieve that larger goal.
Each assessment follows a standard process pattern of running the assessment, analyzing the results, taking action and, lest we forget, celebrating the victories.
SAFe Business Agility Assessment
The SAFe Business Agility Assessment is a high-level assessment that summarizes how Agile the business is at any point in time. The assessment report provides a visualization that shows progress measurements across the SAFe seven core competencies. An example report is shown below in Figure 1.

The spreadsheet version of the assessment can be downloaded here and is available in multiple languages.
[scd_56781 title=”icon-note” css_classes=”brand-primary” ] Note for SAFe Community Members: All the SAFe assessments are also available for SAFe Community Members online through our partner Comparative Agility. This provides additional capabilities for data collection, analysis, comparison, and trending that can be used to improve performance. Access these from the Measure and Grow community page.
Running the Business Agility Assessment
Assessing business agility status is not a trivial feat. Opinions abound, the data is lumpy, and the ways of working are evolving at the same time as the assessment is taking place. Therefore, simply sending the assessment out to various participants and asking them to fill in the data will probably not provide the right experience or accurate results. Instead, we recommend a facilitated session with someone trained in the nuances of SAFe and the assessment process. An experienced SPC is probably a good choice.
Two assessment patterns can be used:
- Each participant fills the assessment independently and then the group discusses and analyzes the results together
- All participants discuss each statement together and reach a consensus on the score for each statement
Both patterns have their benefits and disadvantages. Trust the facilitator to pick the right pattern based on group dynamics, distribution, and time frame.
Analyzing Business Agility Assessment Results
With the data from the assessment in hand, the next step is to analyze the results. During the analysis, it is important to identify significant variances in opinion. The facilitator should review each area of disagreement and explore the differing views. These might stem from a different understanding of the statement itself, or from disagreement about where the group is in the specific dimension. The goal is to explore the differences to get better alignment of where improvement is needed. This is a significant part of the collaborative learning experience.
Core competencies that the group has assessed as problematic can then be explored to understand the reasons that drove people to score themselves low. In addition to pointing out areas needing improvement, the assessment allows portfolios to see visible improvements in performance or ‘wins’. The wins are small multiplying milestones that encourage teams to consolidate those gains and produce more change, as Kotter’s model [2] suggests.
The facilitator should also be aware of the Dunning-Kruger effect [3], in which people tend to assess their ability as greater than what it really is. This means that core competencies that seem unnaturally high might also require an examination to make sure the group understands the meaning of the statements in question.
Taking Action on the Business Agility Assessment
Although high level, taking the business agility assessment is, in itself, a learning experience. Many questions directly set expectations of behaviors, activities or outcomes that can be reasoned about and discussed. For example, a question about continuous learning such as “Our organization provides time for innovation” is fairly clear, and the implied corrective action is fairly obvious.
Further in the Figure 1 example above, the enterprise scored low in Lean Portfolio Management. That could be because they are ineffective at it, but it’s more probable that the enterprise hasn’t started that part of the journey yet. In most cases, a quick look at the implementation roadmap will identify some fairly obvious next steps, with the goal being to steadily improve proficiency across all seven core competencies.
The portfolio or the LACE should routinely re-evaluate their progress toward business agility, perhaps every other PI, and plan the next steps. The measurement frequency depends on the opportunities pursued and how fast the portfolio can reasonably achieve progress. Creating a baseline early on in the transformation, followed by periodic assessments will illustrate improvement trends and allow everyone to communicate successes.
SAFe Core Competency Assessments
In most cases, assessing progress towards business agility spurs the enterprise to greater, and deeper, efforts. That leads the business to explore and start to measure and take more specific action on some or all of the seven core competencies. Structured similarly to the business agility assessment, each core competency assessment has a set of statements, organized by dimension and sub-dimension, that are rated on the same scale as the above. The questions go one step deeper to specific aspects and areas of opportunity and concern along each of the three dimensions of that specific competency. An example report is illustrated in Figure 2.

Running a Core Competency Assessment
As with the business agility assessment, the scope, audience and process for an individual competency assessment must be purpose-built. Perhaps low results in the Agile product delivery competency might require that each Agile Release Train in the portfolio assess its progress in that dimension. Or perhaps it’s an LPM assessment that needs to bring in the right LPM stakeholders. In any case, all the guidance and caveats provided above still apply and attention to culture and careful facilitation is necessary to get the right experience and the right results.
(Note: Each of these more detailed Core Competency assessments can be downloaded from the bottom of this article.)
Analyzing Results of a Core Competency Assessment
The results of a competency assessment are summarized along the three dimensions and several sub-dimensions. But again, there is far more detail in the assessment and far more learnings than the figure alone imply. For example, here’s a sample of questions from the Built-in Quality dimension of the team and technical agility assessment, which by themselves inform stakeholders and imply improvement activities:
Our team adheres to well-defined quality standards
Our team practices both pairing and peer review
Our team applies collective ownership to our work
Our team’s testing practices catch defects early
To reiterate, taking the assessment, whether business agility or core competency, is not a rote mechanical effort. It’s a fostered collaboration replete with its own learnings, and it sets expectations and communicates intent. Therefore even the apparently simple act of taking the assessment will be a significant step in moving towards improvement.
Additionally, it can be useful to analyze the data in the following three ways:
- Highest and lowest average scores: Highest average scores represent those areas where there is the greatest success. Identifying these can help to highlight the results of previous improvement efforts and these strengths can be amplified further as required. The lowest average scores likely represent candidates for the next areas of improvement.
- Most and least standard deviation: Often the assessments will highlight differences in opinion. Comparing the standard deviation across the responses will illustrate where there is broad agreement on the progress being made as well as those areas where there is disagreement. The latter warrants further investigation as it may point to siloed improvement efforts or challenges with communication or consistency of practice.
- Comparison to a benchmark: One of the significant benefits of the assessments is that they can be used to show improvement trends over time. Comparing against a previous data set will immediately demonstrate whether our improvement efforts have been successful in delivering the expected benefits.
To help manage WIP and focus improvement efforts it is recommended to use this analysis to identify no more than five assessment statements that represent strengths and five statements that represent opportunities. The strengths will be amplified and celebrated, and the opportunities will be acted upon, as described in the next step.
Taking Action from a Core Competency Assessment
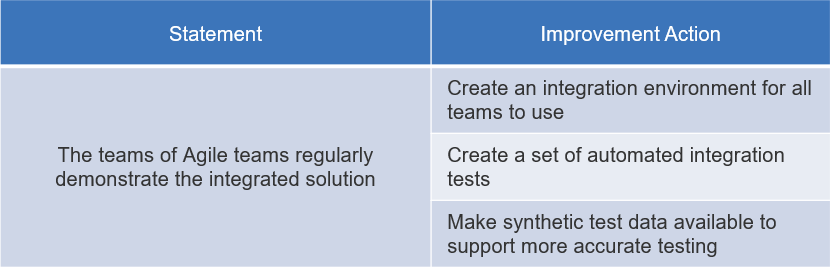
The next step is to identify the actions that will increase proficiency. A common approach is to collectively brainstorm improvement actions for each statement that has been identified as an opportunity. Following this, affinity grouping and dot voting can be used in order to get to 1-3 improvement actions per statement (Figure 4). Rarely is it the case that a single action can address all the challenges highlighted in an assessment statement and therefore multiple activities will ensure that all facets are covered.
Finally, across all the assessment statements being addressed, these improvement actions become potential backlog items that can be prioritized as described in the next step:
Prioritizing Improvement Opportunities
In order to limit Work in Process (WIP) (see SAFe principle #6) and assure that something does indeed get done, it is helpful to prioritize the improvement actions and choose one or two that will provide the most value immediately. Much like prioritizing features in the Program Backlog uses economic ranking with Weighted Shortest Job First (WSJF), the same approach can be used to identify the best next opportunity to pursue.
A simple table to compare opportunities via WSJF is shown in Figure 5 below.
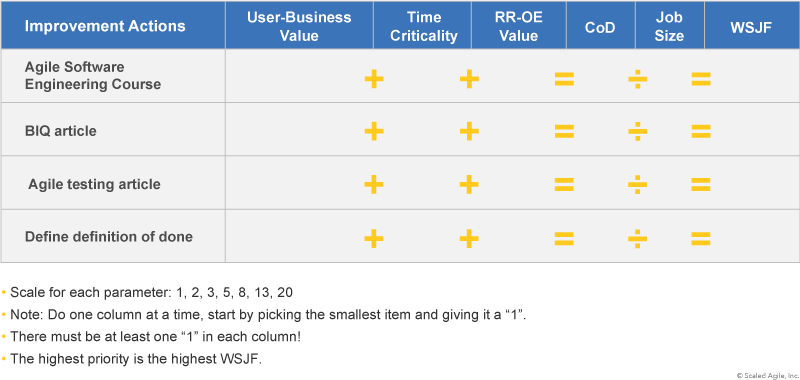
This approach will help the group select the improvement opportunities that yield the biggest impact with the least effort.
The prioritized opportunities then go into the LACE backlog, the Portfolio Backlog, or the ART backlog to be worked on as soon as possible. The backlog of choice depends on the opportunity. For example, an opportunity to restructure ARTs by running a Value Stream and ART Identification Workshop will likely be on the LACE backlog, while a recommendation to train all Scrum Masters might belong in the program or the portfolio backlog.
[scd_56781 title=”icon-note” css_classes=”brand-primary” ] Note for SAFe Community Members: The online version of the Team and Technical Agility core competency assessment, available through our partners AgilityHealth and Comparative Agility, includes a curated set of Growth Recommendations for each assessment statement. There are steps you can take to address the most common root cause of each assessment statement. Access these from the Measure and Grow community page.
Core Competency Assessment Downloads
The following table provides download links for each of the core competency assessments and the links to the individual grows forum for each.
Measuring and Managing DevOps Maturity
In addition to the business agility and core competency assessments, the SAFe DevOps Health Radar (Figure 6) is an assessment that helps ARTs and Solution Trains optimize their value stream performance. It provides a holistic DevOps health check by assessing the maturity of the four aspects and 16 activities of the continuous delivery pipeline. The Health Radar is used to measure baseline maturity at any point in a DevOps transformation and guide fast, incremental progress thereafter.
Note: The DevOps Health Radar should be used alongside the Agile Product Delivery assessment to ensure full coverage of all three dimensions of the APD core competency.
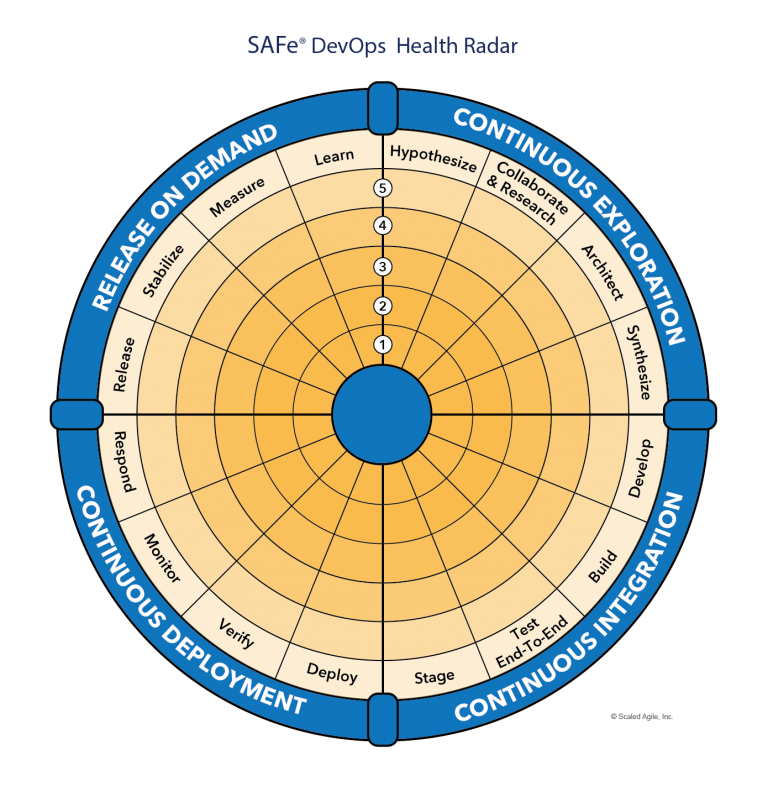
Download the free DevOps Health Radar assessment here. AgilityHealth also offers an online version of this assessment.
Celebrate successes
Lastly, change is hard. Continuous change is hard continuously. The smart enterprise uses small wins to celebrate progress and inspire people to the next achievement milestone. There are many opportunities to celebrate: such as when a portfolio, ART, or team moves from one level to the next in each dimension; or perhaps even manage to change a single assessment statement from ‘mostly false’ to ‘mostly true’. Celebrating successes creates the fuel needed for more improvement and advancement on the journey towards business agility.
These milestones can also provide an opportunity for organizations to gamify the business agility journey. This, in turn, can motivate individuals and teams to intensify their focus on the activities that will help them and their portfolio to achieve their goals.
In addition, tying the improvement to changes in the Value Stream KPIs and LPM metrics connects the effort to the portfolio’s measures of overall success. In this way, the entire portfolio can focus on measurement, and celebrate growth and positive outcomes.
Learn More
[1] Heath, Chip, and Dan Heath. The Power of Moments: Why Certain Experiences Have Extraordinary Impact. Simon & Schuster, 2017. [2] Kotter, John P. Leading Change. Harvard Business Review Press, 2012. [3] en.wikipedia.org/wiki/Dunning%E2%80%93Kruger_effect
Last update: 30 April 2022